
SpringCloud教程第13篇:Turbine
上一篇文章讲述了如何利用Hystrix Dashboard去监控断路器的Hystrix command。当我们有很多个服务的时候,这就需要聚合所以服务的Hystrix Dashboard的数据了。这就需要用到Spring Cloud的另一个组件了,即Hystrix Turbine。
一、Hystrix Turbine简介
看单个的Hystrix Dashboard的数据并没有什么多大的价值,要想看这个系统的Hystrix Dashboard数据就需要用到Hystrix Turbine。Hystrix Turbine将每个服务Hystrix Dashboard数据进行了整合。Hystrix Turbine的使用非常简单,只需要引入相应的依赖和加上注解和配置就可以了。
二、准备工作
本文使用的工程为上一篇文章的工程,在此基础上进行改造。因为我们需要多个服务的Dashboard,所以需要再建一个服务,取名为service-lucy,它的基本配置同service-hi,具体见源码,在这里就不详细说明。
三、创建service-turbine
引入相应的依赖:
<dependencies>
        <dependency>
            <groupId>org.springframework.cloud</groupId>
            <artifactId>spring-cloud-starter-turbine</artifactId>
        </dependency>
        <dependency>
            <groupId>org.springframework.cloud</groupId>
            <artifactId>spring-cloud-netflix-turbine</artifactId>
        </dependency>
        <dependency>
            <groupId>org.springframework.boot</groupId>
            <artifactId>spring-boot-starter-actuator</artifactId>
        </dependency>

        <dependency>
            <groupId>org.springframework.boot</groupId>
            <artifactId>spring-boot-starter-test</artifactId>
            <scope>test</scope>
        </dependency>
    </dependencies>
在其入口类ServiceTurbineApplication加上注解@EnableTurbine,开启turbine,@EnableTurbine注解包含了@EnableDiscoveryClient注解,即开启了注册服务。
@SpringBootApplication
@EnableTurbine
public class ServiceTurbineApplication {

    public static void main(String[] args) {

            new SpringApplicationBuilder(ServiceTurbineApplication.class).web(true).run(args);
    }
}
配置文件application.yml:
spring:
  application.name: service-turbine
server:
  port: 8769
security.basic.enabled: false
turbine:
  aggregator:
    clusterConfig: default   # 指定聚合哪些集群,多个使用","分割,默认为default。可使用http://.../turbine.stream?cluster={clusterConfig之一}访问
  appConfig: service-hi,service-lucy  ### 配置Eureka中的serviceId列表,表明监控哪些服务
  clusterNameExpression: new String("default")
  # 1. clusterNameExpression指定集群名称,默认表达式appName;此时:turbine.aggregator.clusterConfig需要配置想要监控的应用名称
  # 2. 当clusterNameExpression: default时,turbine.aggregator.clusterConfig可以不写,因为默认就是default
  # 3. 当clusterNameExpression: metadata['cluster']时,假设想要监控的应用配置了eureka.instance.metadata-map.cluster: ABC,则需要配置,同时turbine.aggregator.clusterConfig: ABC
eureka:
  client:
    serviceUrl:
      defaultZone: http://localhost:8761/eureka/
配置文件注解写的很清楚。
四、Turbine演示
依次开启eureka-server、service-hi、service-lucy、service-turbine工程。
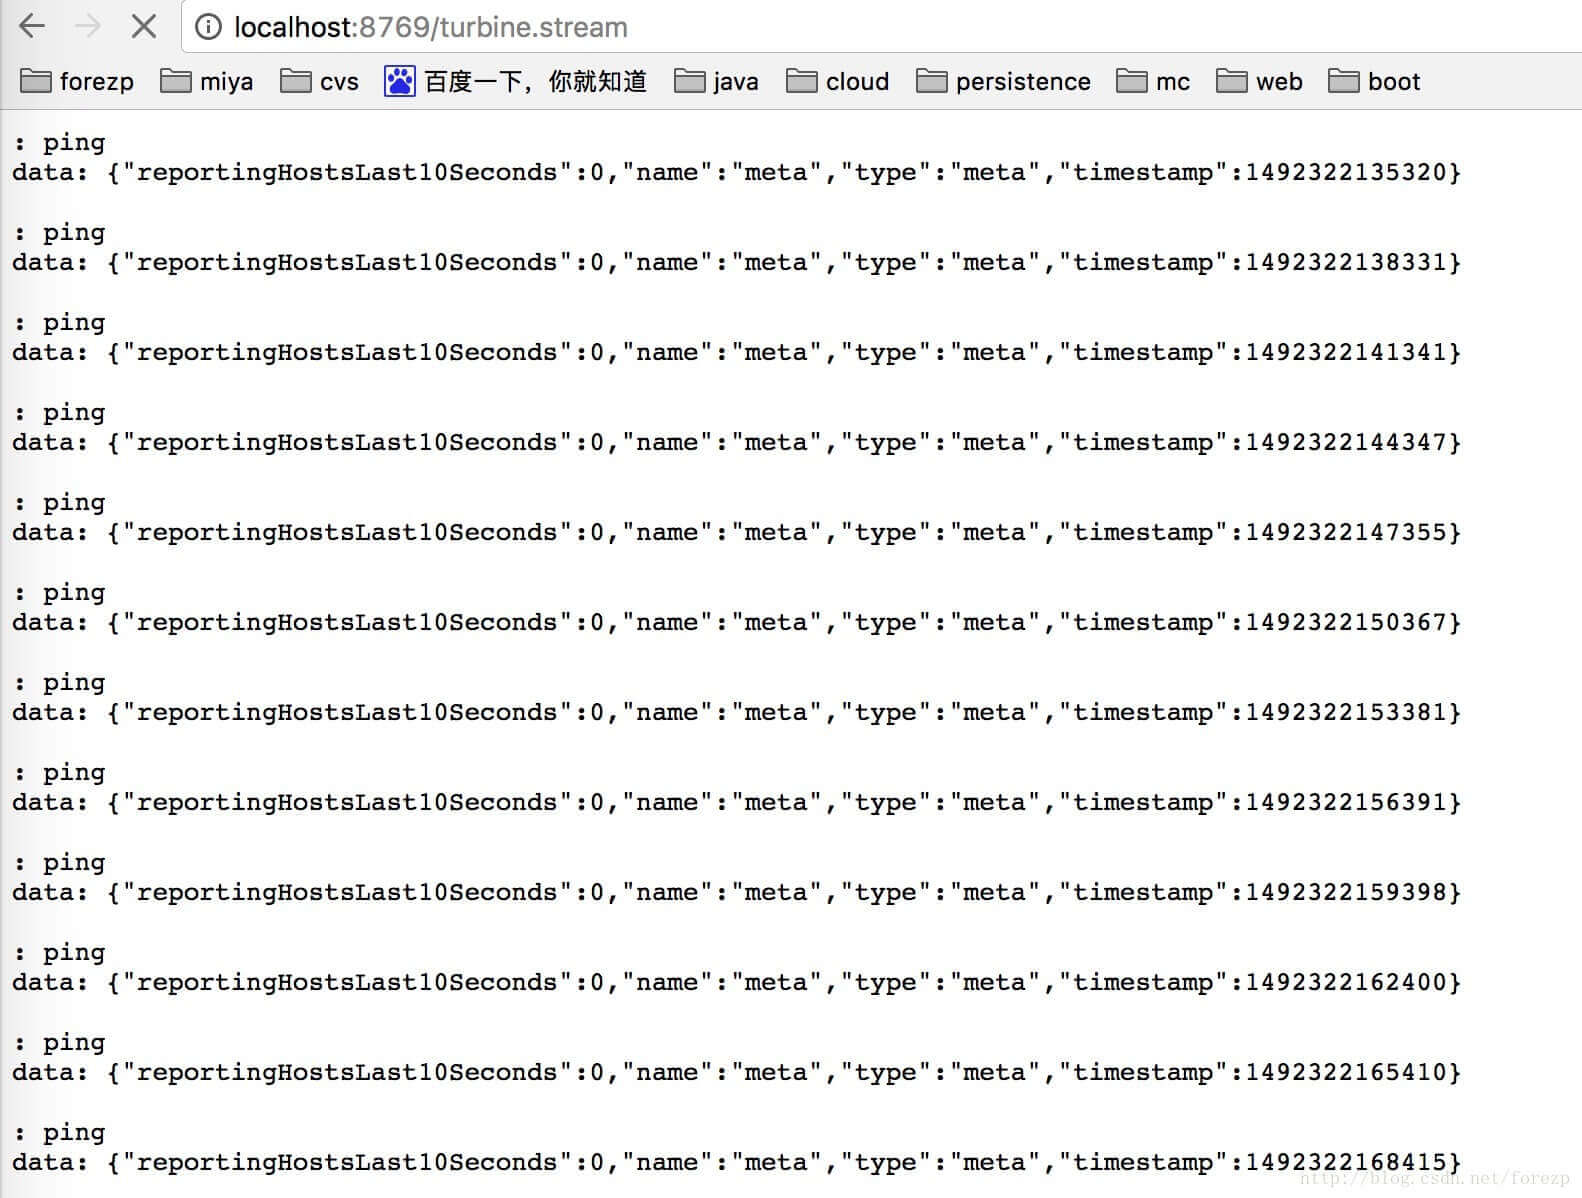
打开浏览器输入:http://localhost:8769/turbine.stream,界面如下:

依次请求:
http://localhost:8762/hi?name=forezp
http://localhost:8763/hi?name=forezp
打开:http://localhost:8763/hystrix,输入监控流http://localhost:8769/turbine.stream
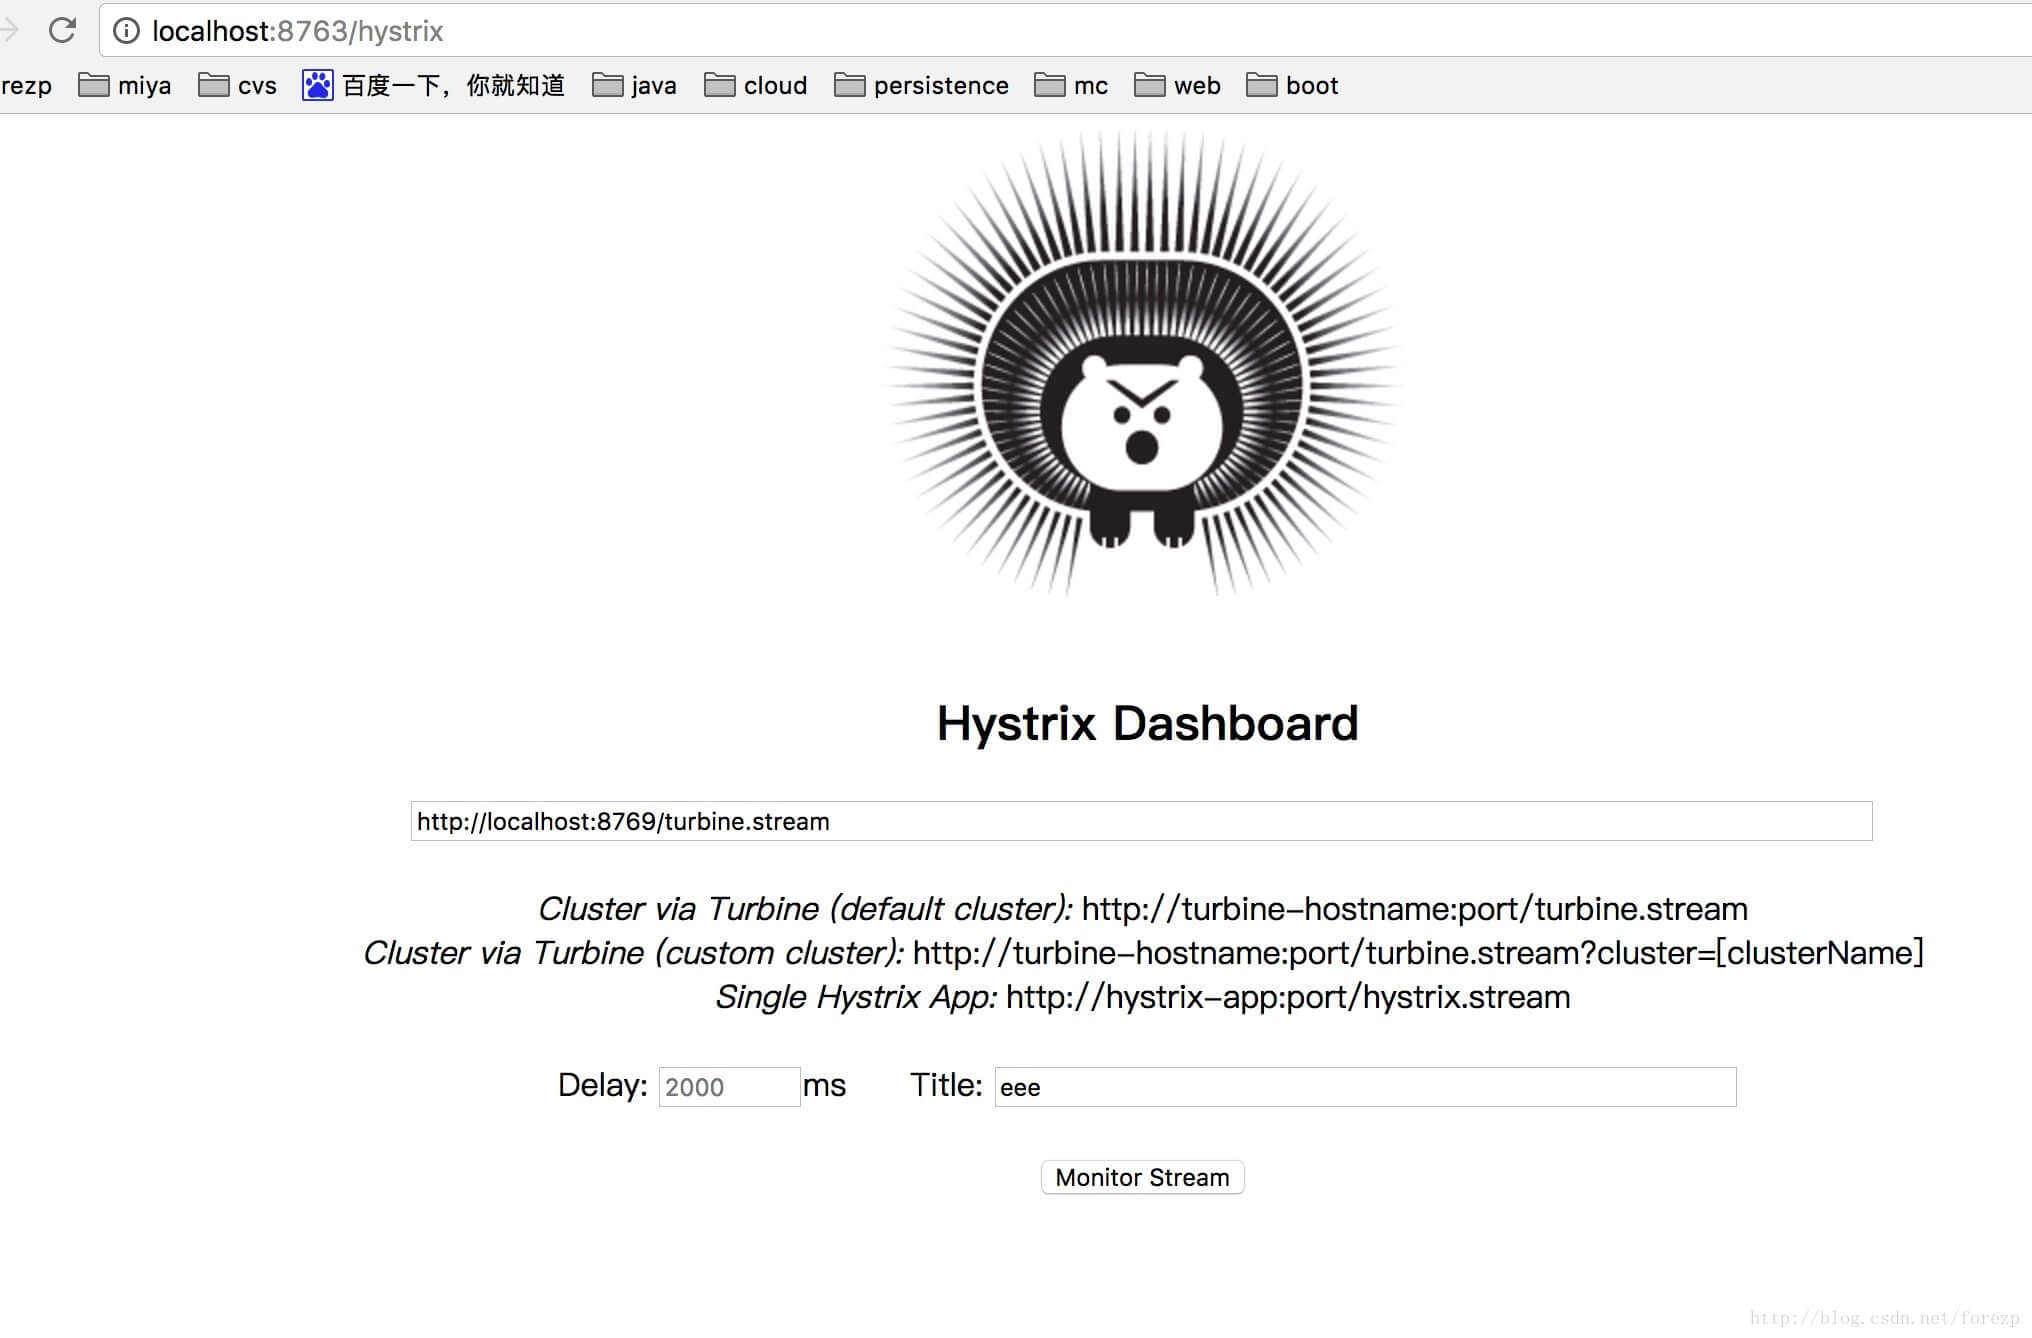
点击monitor stream 进入页面:
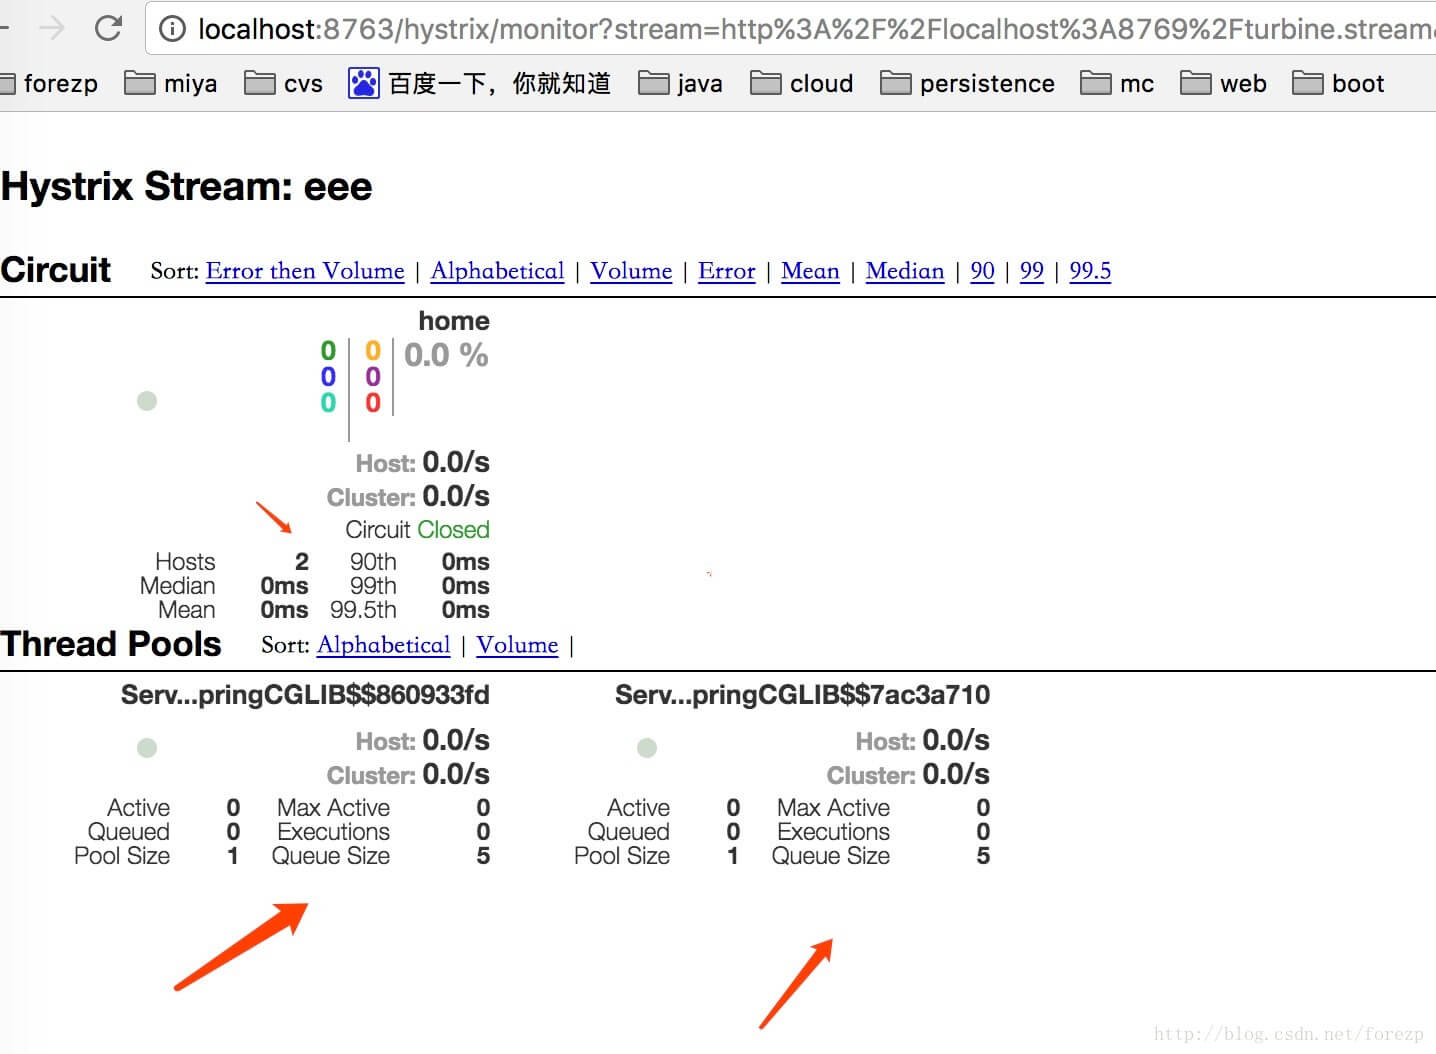
可以看到这个页面聚合了2个service的hystrix dashbord数据。
源码下载:
https://github.com/forezp/SpringCloudLearning/tree/master/chapter13
五、参考文献
优秀文章推荐:
看完两件小事
如果你觉得这篇文章对你挺有启发,我想请你帮我两个小忙:
- 把这篇文章分享给你的朋友 / 交流群,让更多的人看到,一起进步,一起成长!
- 关注公众号 「方志朋」,公众号后台回复「666」 免费领取我精心整理的进阶资源教程

本文著作权归作者所有,如若转载,请注明出处
转载请注明:文章转载自「 Java极客技术学习 」https://www.javajike.com
 微信扫一扫
微信扫一扫